Investors maximize the risk adjusted returns of their portfolios. This means investors do not just maximize expected returns, and investors do not just minimize risk. Investors try to maximize the return-to-risk tradeoff subject to other constraints.
Risk is often thought of as volatility in academics. However, many practitioners, including Warren Buffet, think of risk as permanent loss of capital. Practitioners rarely debate the volatility of their investment ideas or portfolios. Practitioners more often describe how their estimate of intrinsic value differs from the value of the market. Practitioners invest in stocks with wider differences between their intrinsic value and market value. This distance provides a sense of safety.
When academics talk about portfolios in terms of returns and volatility, they focus on how stocks covary with each other. If all stocks are perfectly correlated, then the volatility is higher than if the stocks are imperfectly correlated. Diversification is easier to achieve if stocks are less correlated, and there are no benefits to diversification if stocks are perfectly correlated.
However, diversification can also be by multiples. Do you care more if the stocks in your portfolio covary together in the short term? Or do you care more whether the B/M value of stocks in your portfolio covaries more together? I would say you care whether B/M value is correlated because if B/M increases for all stocks in portfolio, then portfolio has seen a big decline in value independent of the actual book value of the companies you own.
One reason why we don't think about multiples is that we don't observe book value in real time. This makes it hard to judge whether stocks covary together in terms of multiples.

Insights into financial behavior
Sunday, May 31, 2015
Saturday, April 18, 2015
More Low Income Households Earn Dividends When Rich Households Earn More
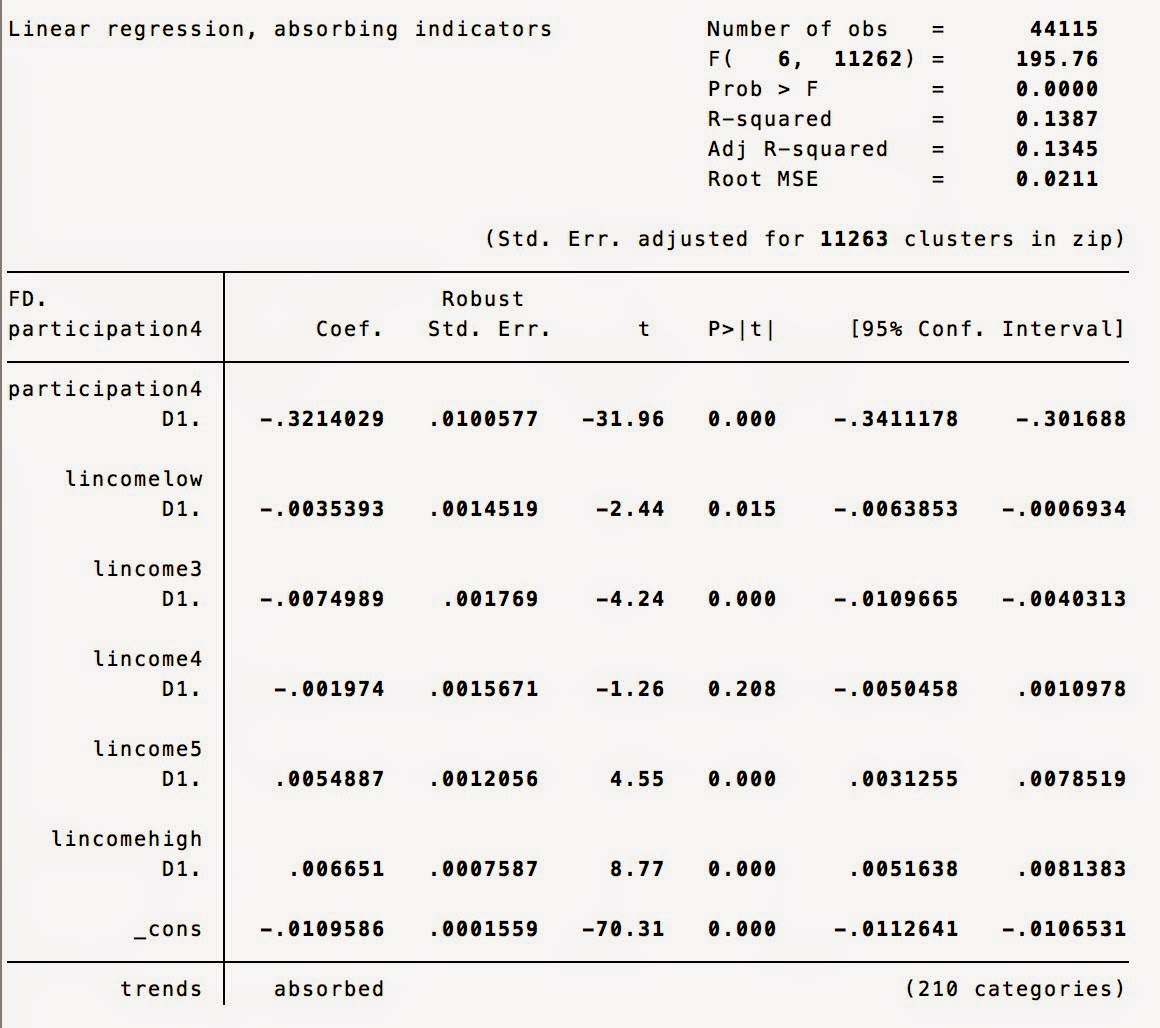
The regression below examines how future differences in participation in the stock market by low income households correlates with current changes in participation by low income households and changes in current incomes for various categories of households by adjusted gross incomes.
The results suggests that when low income households have higher total incomes, they tend to participate more in the stock market. The incomes of the middle class do not really matter for participation of low income households. However, interestingly, the incomes of high income households covary positively with future participation by low income households. The relation is very statistically significant with a t-stat of 16.77. The coefficient is also a magnitude larger than the other coefficients.
The results for changes in participation in the stock market make sense. Changes in the participation of high income households do not seem to matter at all for future changes in the participation of low income households. However, 53% of these high income households already participate, so there may be less change. However, changes in the participation of households earning $25-75k do seem to matter for the participation of low income households.
Perhaps, when tax payers earning over $100k earn more in a given year, they provide more retirement benefits to employees in the form of stock ownership. This would explain why the income of these high earners is associated with higher participation for all income groups (see below regressions). The higher income of high income tax payers do not predict increases in participation for high income tax payers, but this may be again due to the idea that over 50% of them are already earning dividends, so there is no real change on the extensive margin (i.e. new people choosing to invest in the market).
If we don't think of the high income earners as the bosses, then perhaps the high income earners demand the retirement benefits from their firms. The firms may then give the benefits to all employees.

The more individuals earn who earn over $100k, the more participation by households earning $25-50k

The more individuals earn who earn over $100k, the more participation by households earning $50-75k
The more individuals earn who earn over $100k, the more participation by households earning $75-100k
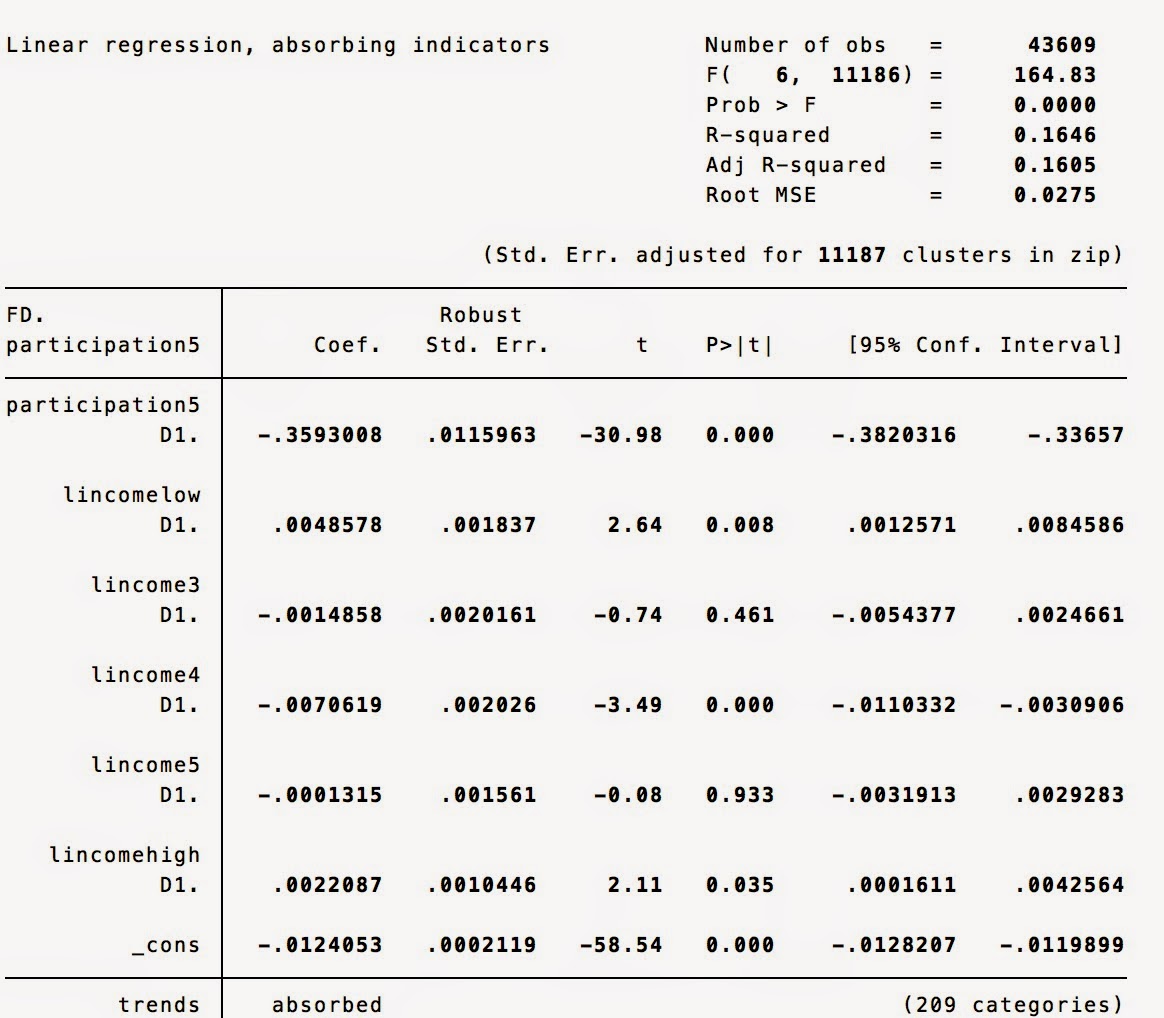
However, the strange result is that the more earned by individuals with incomes over $100k, the less future change in participation in the market. Perhaps, these high earners are already invested in the markets, so there is not much effect of higher incomes on the extensive margin. The highest income individuals have by far the highest stock market participation rates supporting this conclusion.

Does a Growing Local Economy Mean More or Less Low Income Households?
The regressions below use IRS zip code level data. The first regression regresses future changes in the number of returns filed by the lowest income households (<$25k agi) on the current changes in returns for all categories of household incomes.
Imagine a local economy that is performing better than other local economies in a state (time fixed effects included). I would imagine seeing more higher income tax payers. The trend for low income tax payers is ambiguous. On the one hand, the number of low income tax payers will decline as the economy improves and wages increase. On the other hand, more unemployed people may enter the workforce, especially at lower salary levels. This ambiguous outcome of an improving local economy on the number of low income tax payers may explain the insignificant coefficient on the the change in low income tax payers (lnreturnslow).

Imagine a local economy that is performing better than other local economies in a state (time fixed effects included). I would imagine seeing more higher income tax payers. The trend for low income tax payers is ambiguous. On the one hand, the number of low income tax payers will decline as the economy improves and wages increase. On the other hand, more unemployed people may enter the workforce, especially at lower salary levels. This ambiguous outcome of an improving local economy on the number of low income tax payers may explain the insignificant coefficient on the the change in low income tax payers (lnreturnslow).
lnreturns "log number of returns"
lnreturnslow "log number of returns for taxpayers earning less than $25k in a zip code"
State Time trends are controlled for in both regressions
How correlated are individual's financial decisions?
Aggregate time fixed effects explain 18.5% (R^2) of the variation
in reported dividends by individuals earning $25k or less, around 2% for every
one else except around 5% for individuals earning more than $100k. These “aggregate”
time fixed effects suggest that there is a lot of covariance in financial
decisions for low-income individuals across the United States independent of state,
city or zip-code level factors.
See regressions below:
Y=Change in Fraction of Low Income Population in a Zip Code (<$25k AGI) reporting Taxable Dividends
X=Aggregate Time Fixed Effects

A Market Beta of 1 in the Fama French Model
The Fama French model explains the average returns of portfolios using the average returns of three factors - the excess market return, the return on a long-short portfolio of small stocks and big stocks (SMB), and the return on a long-short portfolio of high book-to-market stocks minus and low book-to-market stocks (HML).
The Fama French model is so widely used because the model does a good job at explaining 90% or more of the variation of expected returns of portfolios in a cross section. This point is important - the Fama French model does not forecast future returns. Rather, the model explains variation in the cross section. What this means is that if you know the excess market return, the return on SMB and the return on HML and a portfolio's loadings on these 3 factors (estimated using historical data), then you can explain 90% of the difference in portfolio returns that day. This reduction of most of the variation of portfolio returns to three factors is quite remarkable!
Now, portfolios tend to all have a beta of 1 on the excess market return. This means that if you control for variation in SMB and HML, the average returns covary with the market one-for-one. In other words, if I give you a portfolio, you can estimate the portfolio's loadings on SMB and HML. You can use these estimated loadings to control for the portfolio's tilt towards SMB or HML. After controlling for the tilt of the portfolio, the remaining portfolio covaries with the market one-for-one.
Thursday, April 16, 2015
Trends in Stock Market Participation by Household Income
Why do we care about how many people participate in the stock market? Well, stocks are claims to the future cash flows of companies. Stocks therefore provide a means for individuals to own a piece of economic growth. Individuals who do not participate may see improvement in their living standards over time, but their relative living standard will fail to keep pace with those owning stocks if the global economy continues to expand and innovate.
The chart below shows the median fraction of households reporting dividends in the U.S. by income category. The data is zip code level, so each point represents the median fraction of adults reporting dividends across all zip codes in the U.S. by income level.
Investors holding broad portfolios will receive a dividend, so the dividend is a measure of stock market participation. The measure is imperfect because not all stocks pay dividends. Investors still have to report dividends even if the dividends are reinvested.
Evident in the chart, households earning more than $100k annually are much more likely to hold stocks than households earning less than $25k and households earning $25-100k. Approximately 50-60% of tax payers earning more than $100k report dividends. Only 20-30% of households earning $25-100k hold stocks. And less than 15% of households earning less than $25k hold stocks.

Tuesday, March 17, 2015
Customers are financeers
Customers finance companies by paying companies more than the total costs of producing the product. Total costs include the direct materials and direct labor used to produce the product as well as the factory, management staff, etc. Companies producing more relevant and desirable products are able to extract more profit from their customers.
Profits are an important source of financing for companies. Customers paying firms profits do not require compensation in return. Customers do not require subsequent interest payments or ownership interests. Companies can use the profits to expand organically, without having to raise outside capital that comes with demands.
Why is outside capital more costly? Outside capital finances the company so that the company can extract profits from customers in the future. The ability of the company to produce a relevant product and extract future profits is uncertain and risky. Outside capital requires compensation for bearing risks.
Subscribe to:
Comments (Atom)