Investors maximize the risk adjusted returns of their portfolios. This means investors do not just maximize expected returns, and investors do not just minimize risk. Investors try to maximize the return-to-risk tradeoff subject to other constraints.
Risk is often thought of as volatility in academics. However, many practitioners, including Warren Buffet, think of risk as permanent loss of capital. Practitioners rarely debate the volatility of their investment ideas or portfolios. Practitioners more often describe how their estimate of intrinsic value differs from the value of the market. Practitioners invest in stocks with wider differences between their intrinsic value and market value. This distance provides a sense of safety.
When academics talk about portfolios in terms of returns and volatility, they focus on how stocks covary with each other. If all stocks are perfectly correlated, then the volatility is higher than if the stocks are imperfectly correlated. Diversification is easier to achieve if stocks are less correlated, and there are no benefits to diversification if stocks are perfectly correlated.
However, diversification can also be by multiples. Do you care more if the stocks in your portfolio covary together in the short term? Or do you care more whether the B/M value of stocks in your portfolio covaries more together? I would say you care whether B/M value is correlated because if B/M increases for all stocks in portfolio, then portfolio has seen a big decline in value independent of the actual book value of the companies you own.
One reason why we don't think about multiples is that we don't observe book value in real time. This makes it hard to judge whether stocks covary together in terms of multiples.

Insights into financial behavior
Sunday, May 31, 2015
Saturday, April 18, 2015
More Low Income Households Earn Dividends When Rich Households Earn More
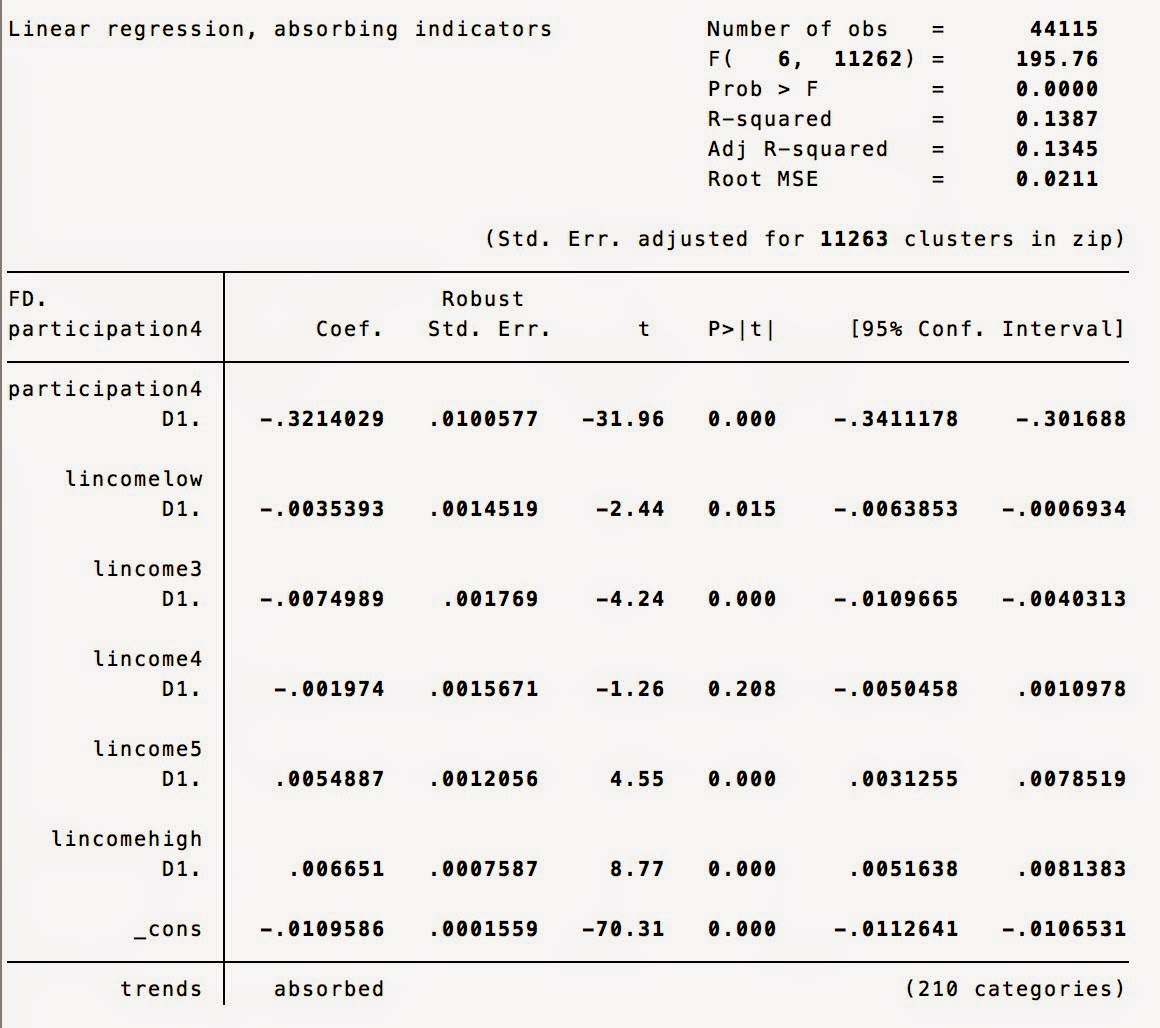
The regression below examines how future differences in participation in the stock market by low income households correlates with current changes in participation by low income households and changes in current incomes for various categories of households by adjusted gross incomes.
The results suggests that when low income households have higher total incomes, they tend to participate more in the stock market. The incomes of the middle class do not really matter for participation of low income households. However, interestingly, the incomes of high income households covary positively with future participation by low income households. The relation is very statistically significant with a t-stat of 16.77. The coefficient is also a magnitude larger than the other coefficients.
The results for changes in participation in the stock market make sense. Changes in the participation of high income households do not seem to matter at all for future changes in the participation of low income households. However, 53% of these high income households already participate, so there may be less change. However, changes in the participation of households earning $25-75k do seem to matter for the participation of low income households.
Perhaps, when tax payers earning over $100k earn more in a given year, they provide more retirement benefits to employees in the form of stock ownership. This would explain why the income of these high earners is associated with higher participation for all income groups (see below regressions). The higher income of high income tax payers do not predict increases in participation for high income tax payers, but this may be again due to the idea that over 50% of them are already earning dividends, so there is no real change on the extensive margin (i.e. new people choosing to invest in the market).
If we don't think of the high income earners as the bosses, then perhaps the high income earners demand the retirement benefits from their firms. The firms may then give the benefits to all employees.

The more individuals earn who earn over $100k, the more participation by households earning $25-50k

The more individuals earn who earn over $100k, the more participation by households earning $50-75k
The more individuals earn who earn over $100k, the more participation by households earning $75-100k

However, the strange result is that the more earned by individuals with incomes over $100k, the less future change in participation in the market. Perhaps, these high earners are already invested in the markets, so there is not much effect of higher incomes on the extensive margin. The highest income individuals have by far the highest stock market participation rates supporting this conclusion.

Does a Growing Local Economy Mean More or Less Low Income Households?
The regressions below use IRS zip code level data. The first regression regresses future changes in the number of returns filed by the lowest income households (<$25k agi) on the current changes in returns for all categories of household incomes.
Imagine a local economy that is performing better than other local economies in a state (time fixed effects included). I would imagine seeing more higher income tax payers. The trend for low income tax payers is ambiguous. On the one hand, the number of low income tax payers will decline as the economy improves and wages increase. On the other hand, more unemployed people may enter the workforce, especially at lower salary levels. This ambiguous outcome of an improving local economy on the number of low income tax payers may explain the insignificant coefficient on the the change in low income tax payers (lnreturnslow).

Imagine a local economy that is performing better than other local economies in a state (time fixed effects included). I would imagine seeing more higher income tax payers. The trend for low income tax payers is ambiguous. On the one hand, the number of low income tax payers will decline as the economy improves and wages increase. On the other hand, more unemployed people may enter the workforce, especially at lower salary levels. This ambiguous outcome of an improving local economy on the number of low income tax payers may explain the insignificant coefficient on the the change in low income tax payers (lnreturnslow).
lnreturns "log number of returns"
lnreturnslow "log number of returns for taxpayers earning less than $25k in a zip code"
State Time trends are controlled for in both regressions
How correlated are individual's financial decisions?
Aggregate time fixed effects explain 18.5% (R^2) of the variation
in reported dividends by individuals earning $25k or less, around 2% for every
one else except around 5% for individuals earning more than $100k. These “aggregate”
time fixed effects suggest that there is a lot of covariance in financial
decisions for low-income individuals across the United States independent of state,
city or zip-code level factors.
See regressions below:
Y=Change in Fraction of Low Income Population in a Zip Code (<$25k AGI) reporting Taxable Dividends
X=Aggregate Time Fixed Effects

A Market Beta of 1 in the Fama French Model
The Fama French model explains the average returns of portfolios using the average returns of three factors - the excess market return, the return on a long-short portfolio of small stocks and big stocks (SMB), and the return on a long-short portfolio of high book-to-market stocks minus and low book-to-market stocks (HML).
The Fama French model is so widely used because the model does a good job at explaining 90% or more of the variation of expected returns of portfolios in a cross section. This point is important - the Fama French model does not forecast future returns. Rather, the model explains variation in the cross section. What this means is that if you know the excess market return, the return on SMB and the return on HML and a portfolio's loadings on these 3 factors (estimated using historical data), then you can explain 90% of the difference in portfolio returns that day. This reduction of most of the variation of portfolio returns to three factors is quite remarkable!
Now, portfolios tend to all have a beta of 1 on the excess market return. This means that if you control for variation in SMB and HML, the average returns covary with the market one-for-one. In other words, if I give you a portfolio, you can estimate the portfolio's loadings on SMB and HML. You can use these estimated loadings to control for the portfolio's tilt towards SMB or HML. After controlling for the tilt of the portfolio, the remaining portfolio covaries with the market one-for-one.
Thursday, April 16, 2015
Trends in Stock Market Participation by Household Income
Why do we care about how many people participate in the stock market? Well, stocks are claims to the future cash flows of companies. Stocks therefore provide a means for individuals to own a piece of economic growth. Individuals who do not participate may see improvement in their living standards over time, but their relative living standard will fail to keep pace with those owning stocks if the global economy continues to expand and innovate.
The chart below shows the median fraction of households reporting dividends in the U.S. by income category. The data is zip code level, so each point represents the median fraction of adults reporting dividends across all zip codes in the U.S. by income level.
Investors holding broad portfolios will receive a dividend, so the dividend is a measure of stock market participation. The measure is imperfect because not all stocks pay dividends. Investors still have to report dividends even if the dividends are reinvested.
Evident in the chart, households earning more than $100k annually are much more likely to hold stocks than households earning less than $25k and households earning $25-100k. Approximately 50-60% of tax payers earning more than $100k report dividends. Only 20-30% of households earning $25-100k hold stocks. And less than 15% of households earning less than $25k hold stocks.

Tuesday, March 17, 2015
Customers are financeers
Customers finance companies by paying companies more than the total costs of producing the product. Total costs include the direct materials and direct labor used to produce the product as well as the factory, management staff, etc. Companies producing more relevant and desirable products are able to extract more profit from their customers.
Profits are an important source of financing for companies. Customers paying firms profits do not require compensation in return. Customers do not require subsequent interest payments or ownership interests. Companies can use the profits to expand organically, without having to raise outside capital that comes with demands.
Why is outside capital more costly? Outside capital finances the company so that the company can extract profits from customers in the future. The ability of the company to produce a relevant product and extract future profits is uncertain and risky. Outside capital requires compensation for bearing risks.
How ripped off are passive stock market investors?
A famous activist investor, Mark Rachesky, said in an interview, "We are extremely hands-on, and I've always been a believer that if you are not in control then somebody else is and they aren't looking out for you." (February 11, 2014)
This quote reveals an important lesson for passive investors - no one is looking out for your interests. So why would a passive investor have performed so well over the past century in the U.S. stock market? Why weren't passive investors more ripped off?
Whoever controls a company, whether a large investor or executives, the controller (not owner) is interested in maximizing the controller's value. The controller of the firm can earn by increasing the stock price, but the controller can also earn by extracting private benefits from a company at the expense of the shareholders.
Mark Rachesky is a firm believer that one can gain substantial influence over a company without paying the control premium of an out-right leveraged buy-out or acquisition. For Rachesky, owning 20% of the equity or more already affords him many of the benefits of control. In some sense, Rachesky is leveraging because he control the firm without having to own 100% of the shares.
Large investors like Mark Rachesky are then able to extract private benefits from the company. Assume that a controller of the firm takes out $1 million. If the market is aware of this but did not suspect it, the stock price falls so that the market capitalization of the company falls by $1 million. However, the controller of the firm owns less than 100% of the equity, so the penalty of taking out the $1 million is only a loss on shares proportional to holdings. If own 20% of the stock, then loses $200,000.
Controlling investors can extract many types of benefits. For example, a controlling investor can delay investments or delay providing "activist" advice until the investor has accumulated his or her full stock position. This way the controller does not pay for the value the controller plans to add. The market may have some expectation of the value a controller may add, but this expectation is uncertain and will not be fully priced in to the stock.
Controlling investors can also access board seats and management more easily. This access provides tremendous amounts of valuable information. Often investors focus on sectors where their network sources opportunities. Access to important information is a large private benefit for these controlling investors.
While the equity premium is a puzzle in finance? A related puzzle is why does an equity premium exist when all firms are controlled by someone who also wants private benefits? Perhaps, the equity premium represents the minimum "bribe" to the shareholders to get them to accept the arrangement.
Sunday, March 8, 2015
Who's at fault for the Greek sovereign crisis?
The current negotiation game in Europe is to pin losses on Greek defaults on the tax payers of another country. The difficulty of determining who should lose is determining who is at fault. I cannot put my thumb squarely on who is at fault.
Is Greece at fault for borrowing heavily? Or was Greece logically exploiting access to much cheaper financing by being a member in the EU? Regardless, Greece has lost credibility in the international financial markets. Unless Greece can adhere to austerity requirements and pay down the debt slowly, Greece will have a permanent black mark in Greece's credit history.
Are the banks and countries financing Greece at fault? These financiers (often German) made the choice of parting with their funds. The financiers may have expected the EU to never default on debt or Germany to bailout any peripheral country in trouble. However, just because the financiers had incorrect expectations does not mean they should not bear the consequences of their risks. Germany stands to benefit from Greece only slowly improving since uncertainty about Greece keeps the euro from appreciating against other countries. A weaker euro makes German exports look more attractive. Germany has an incentive to keep Greece on the verge of bankruptcy for as long as possible unless the cost of bailing out Greece becomes too large.
Are the taxpayers of any country off the hook? Well, the taxpayers are most likely going to bear any losses. Banks cannot bear losses because imposing losses on banks weakens the financial system important for production and growth. Tax payers are responsible for electing their governments, and tax payers also benefit in the short term from faster economic growth and more employment. The tax payers may be the most naive when it comes to making choices regarding the financial system, but naïveté is no excuse against suffering consequences.
Is the structure of the EU at fault? The EU is a monetary union but not a fiscal union. Member countries all have incentives to act in their interests at the expense of other countries. The prolonged discussions about resolving the EU crisis reflect this lack of fiscal integration since no EU institution controls the fiscal choices of a country. The fiscal requirements in the Stability and Growth Pact that were supposed to constrain fiscal choices of member countries were relaxed when Germany and France did not want to pay penalties in 2005. Germany and France were running excessive deficits under the definition of the pact for years. Once Germany and France waived the penalties on themselves, Greece and other countries saw an opportunity to ignore the fiscal requirements in the pact.
Wednesday, March 4, 2015
When do sunk costs matter for choices? An explanation of the sunk cost fallacy
A sunk cost is an unrecoverable past cost. Business school professors like to advise MBAs to ignore sunk costs when making strategic decisions. The lesson boils down to don't throw money at a bad investment when better investments are available. People have a tendency to get attached to projects or investments they have spent a lot of time with and a lot of money on. People hope to recover from bad decisions by dedicating more resources to the problems. The advice suggests that people should wipe their hands of bad decisions and strategize their investments on the margin. The logic is that one cannot go back and change the sunk expenses, so one should forget about them and choose the highest NPV (net present value) project available for new investments.
The sunk cost fallacy arises because the common definition of sunk cost is sometimes not fully appreciated. A sunk cost is not only a cost that is unrecoverable and possibly performed very poorly. A sunk cost requires that the value of the original investment can in no way be altered by current choices.
To help appreciate this nuance, consider the following example. If one half-builds a shopping mall, one has made plenty of unrecoverable investments. If one stops at any moment, then the value of the already made investments is very low, making the investments look bad. Perhaps one put in $100 million but the mall in the current condition is only worth $50 million.
Now lets think of what to do with the next million dollars. A marginal decision would examine only the return on the million dollars invested in different projects. Imagine that an investment other than the mall offers an astounding 100% return for sure - so that the one million becomes two million in a year. Assume that the investment in the mall yields 0% on the new one million. If the definition of a sunk cost is not fully appreciated, then one might be tempted to take the other project and make a 100% return.
However, this strategy ignores the possibility that the million dollar investment makes a terrible mall investment into a mediocre mall investment. The capital gain on the much larger sum invested in the mall could significantly outweigh the one million dollar gain on the other project. In order for the one million dollar new investment to beat the outside option of a 100% return, all the one million dollars has to achieve with the original mall investment is to raise the value from $51 (including new investment) to $52. In fact, the mall investment may rise from $51 to $75. Even though the investment in the mall is still negative since one put in $100 million, one is better off throwing money at the bad idea because doing so affects the value of the original investment.
So the key element of sunk cost reasoning is that the value of a previous investment or sunk cost cannot be affected by new, marginal investments.
Tuesday, March 3, 2015
Why can't stocks with prices below $1 keep reverse splitting to avoid delisting?
Let's start with defining what a reverse stock split is? A reverse-split is a corporate action in which a company reduces the total number of its outstanding shares. A reverse stock split involves the company dividing its current shares by a number such as 5 or 10. A reverse stock split is the opposite of a conventional stock split, which increases the number of shares outstanding.
Companies have to meet minimum requirements to stay listed on exchanges. The minimum requirements vary by exchange. Let's discuss the minimum requirements for the Nasdaq Capital Markets Companies before answering the question. Each company listed on the Nasdaq has to meet the minimum requirements of at least one of the columns.

Companies have to meet minimum requirements to stay listed on exchanges. The minimum requirements vary by exchange. Let's discuss the minimum requirements for the Nasdaq Capital Markets Companies before answering the question. Each company listed on the Nasdaq has to meet the minimum requirements of at least one of the columns.
A direct limitation on the ability to do repeated reverse stock splits is the requirement to have at least 500,000 publicly held shares. Note that the 500,000 publicly held shares is not the same thing as shares outstanding. Publicly held shares equals total shares outstanding less insider holdings. Insider holdings include shares held by the company's officers, directors, employee stock ownership plan and shareholders with 10% or greater beneficial ownership of the company's shares. Often, companies with smaller market caps have concentrated ownership by insiders or significant shareholders, which more severely constrains the ability to do reverse-splits.
Why do exchanges set these minimum requirements? One possibility is to improve profitability of the exchange. While small stocks pay exchange fees, the exchange also earns revenue by levying taxes on trades. The margins are very low, so a lot of transactions need to be occur to produce real value. This story makes sense if their is a fixed cost to having a stock trade on the exchange and the contribution to the fixed costs is not adequate. Profitability has been an issue for exchanges, which is one reason exchanges have been merging with or acquiring other exchanges. These combinations have synergies by cutting duplicate IT costs for example.
Another possible reason for the minimum requirements is to keep investors out of stocks that are going to perform very poorly. The exchanges have some incentive to weed out poor performers so that investors look at companies trading on the exchange as more reputable. Reputation may lead to lower costs of capital for the firm because of greater trust by investors.
Let's see if reverse stock splits are associated with poorer subsequent performance. In theory nothing about the fundamental value of the business has changed given a stock split or a reverse stock split. However, a variety of papers have documented abnormal returns post splits. Hemang Desai and Prem C. Jain (1997) finds that 1-3 year performance of common stock following stock splits is 7.05% and 11.87% respectively. The 1-3 year performance following reverse splits has abnormal returns of -11% to -34% respectively.
The longer term abnormal returns are a puzzle and suggest that investors under react to information about the business revealed in the corporate action to reverse split the stock. Thus removing under performing companies protects investors.
However, why doesn't the information enter the stock price immediately? Why haven't investors learned about this pattern from historical data and erased the pattern with diversified portfolios shorting reverse split companies and going long forward split companies?
A few theories have materialized to try and explain the information content in a stock split. The first theory relates to managers’ private information about firm fundamentals which the market infers from a stock split announcement, while the second theory relates to increased liquidity that stocks achieve via a split. A more recent catering theory argues that managers split their stock to cater to investors who value lower priced stocks relatively more during certain times. However, none of these theories explain why the pattern in returns has not been exploited immediately.
Saturday, February 28, 2015
Why and when do corporate executives transfer shares to charities or family foundations?
Executives donating appreciated shares of stock to charities or charitable family foundations are able to obtain a personal income tax deduction for the market value of the shares. This tax deduction benefit is greater when the shares have appreciated more. Donating appreciated shares to a charitable organization also nullifies the capital gains tax that would be due if the shares were sold.
Are there restrictions on when executives can make gifts? Gifts of stock are generally not constrained by U.S. insider trading laws. Company officers can then donate shares of stock to charities during periods when selling the shares would be prohibited.
When do executives make these donations? Are they strategic in timing? A preliminary study from NYU suggests that Chairmen and CEOs of public companies often make these gifts prior to sharp declines in their companies' stock prices. Foundations hold the donated stock for long periods rather than diversifying, permitting CEOs to continue voting the shares.
Friday, February 27, 2015
How is difference-in-differences estimation useful for economics and finance?
Difference-in-differences (diff-in-diff) is commonly used in scientific and social science experiments to estimate a treatment effect. A treatment group is shocked or treated and the difference in an outcome variable for the treated group is compared with the difference in the same outcome variable for the control group.
In economic studies using observational data, the researcher does not have a clone of a person so that he can shock one and compare the treated person to his un-treated twin. Often times one region - like a state - is shocked while another state is not shocked. A key assumption researchers make when using diff-in-diff estimation with states is that the trend in the outcome variable for the treated state would have been the same as that of the un-treated state had the treated state not be treated. In other words, we do not see the counterfactual world in which the treated state was not treated. We use the untreated state as a proxy for the counterfactual world behavior but the proxy is an assumption.
The diff-in-diff test allows states to differ so long as the differences can be controlled for. States can have a time-invariant state fixed effect. For example, states can have different fixed legal codes that cause constant differences in the outcome variable. The diff-in-diff test also allows the overall environment to change over time - a year effect that is common across states. For example, a bad stock market may influence the outcome variable in all states equally. Controlling for time fixed effects soaks up all of these period-to-period changes common to all states.
The reason the diff-in-diff allows for time-invariant state fixed effects and time fixed effects is because the diff-in-diff ends up subtracting out these fixed effects. The difference from one period to the next of the treatment group knocks out the time-invariant state fixed effect. The difference leaves behind a difference in time fixed effects - i.e. the time fixed effect in period 1 less the time fixed effect in period 0. The next step - the diff-in-diff - then knocks out the common difference in time fixed effects. The remaining quantity is the treatment effect.
One can estimate a diff-in-diff treatment effect using regression. Regress the outcome variable on a constant, dummy for treatment group, dummy for time period and an interaction of the dummy for treatment group and dummy for time period.
A check on the previous diff-in-diff regression is available with panel data. Regress the outcome variable on a state specific intercept a state specific time trend variable, a time fixed effect across states and the treatment dummy, which is 1 if a state is treated in that time period. One can also add other state-specific time trends as regressors too. This approach allows treatment and control states to follow different trends. It is nice if the estimated effect of interest in the previous diff-in-diff regression is unchanged by inclusion of these trends.
Wednesday, February 25, 2015
Why do regulators ban short sales during crises?
Regulators regularly ban short selling during crises with the intention of stabilizing markets. The SEC halted short selling in the stocks of financial firms in U.S. markets between September 19, 2008 and October 8, 2008. Does banning short selling achieve this objective of stabilization? Short sellers generally receive bad press because they are betting on "declines" rather than "growth." Perhaps, the policy is more to reduce the ability of the informed and typically well-to-do from benefiting from the downturn. Imagine newspapers titled, "Wall Street's boom during Main Street's bust!"
The consequences of temporarily banning short selling are serious. First, short selling is important for market efficiency. Assume that investors with better information were not long the security in the first place. These investors know that the security is worth less and are willing to go short. The ban keeps the possibly better informed investors out of the market. Only the less informed owners of the stock are able to price the stock, but there information is less accurate. Less accurate prices mean policy makers and others have less accurate information about the health of the company or financial system at a time when accurate information is particularly important.
Second, short sellers cannot kill the company. Even if short sellers could force the price down to $0, the company will not fail unless the company cannot make required debt payments i.e. go bankrupt. The press often claims that short sellers can shake investor confidence. Short sellers do shake investor confidence by pricing into the market more negative information than the original investors probably had. For short sellers to really be able to cause unwarranted - erroneous - fear in the market requires an absence of other informed investors (including in the pull of short sellers) from taking the long position and keeping the stock price at an efficient level. Efficiency means the available information to traders is priced into the market.
Third, banning short sellers cuts liquidity. If short selling is integral to efficient prices, then why would investors want to buy stocks that are likely overvalued? Banning short selling defeats both those wanting to sell short and those wanting to go long. Less liquidity hurts existing shareholders who may want or have to reduce positions and sell into less liquid markets, resulting in a larger negative price impact.
Also, bans on selling certain companies short does not eliminate the ability to sell those companies short on other markets - like CDS or options markets.
How can CDS prices be above 10,000?
The reason for the question is that CDS prices are in basis points, so 10,000 basis points is 100%. CDS's insure the holder against a default on the underlying security - in Greece's case a sovereign bond. So shouldn't 10,000 basis points be the ceiling - you can't lose more than 100%, right?
No, the time until default matters too. A CDS price of 10,000 makes sense if one knows that an entity will default in 1 year and that there will be no recovery. If one knows that Greece will default on CDS in 1 month's time with no recovery, then the spread would be 120,000 basis points per year. However, the spread would only be collected for one month. So one still earns (120,000/12=) 10,000 basis points.
No, the time until default matters too. A CDS price of 10,000 makes sense if one knows that an entity will default in 1 year and that there will be no recovery. If one knows that Greece will default on CDS in 1 month's time with no recovery, then the spread would be 120,000 basis points per year. However, the spread would only be collected for one month. So one still earns (120,000/12=) 10,000 basis points.
Should we allow companies to buy deep out of the money put options?
Companies are not currently permitted to buy put options on their own stock or short their own stock.
The obvious concern is that allowing companies to profit from stock price drops incentivizes the executives and shareholders to fail.
The obvious benefit is that if a negative shock occurs to a company, the company receives a payout that helps fund the company with the company needs the cash the most. This payout is valuable if the cash helps avoid costly bankruptcy.
The opportunity to shield companies from negative shocks may lead companies to take on more risky projects than they otherwise would. The cost of more risk is more volatility but also bigger successes (i.e. innovations, profits) if successful. We probably would not want systemic organizations - like big financial firms - to participate though since their individual failures spark failures elsewhere. However, firms that are less systemic could take more risks without the negative externalities.
Is there a way to alleviate the incentives put options create to drive the stock to zero? Yes, require that managers tie their compensation to the firm's value and permit managers to only buy deep out of the money put options. A deep out of the money put option only becomes valuable if the stock price declines "deeply". So long as the managers have enough wealth tied to the firm's stock price, the drop in price prior to hitting the exercise price of the put options would damage the executive's wealth enough to reduce perverse incentives.
How can smart, efficient markets be surprised by earnings announcements?
During earnings announcement season, stocks regularly make big moves up or down depending on how announced earnings compared with market expectations. "Why are market expectations sometimes so wrong?" is a common question I here asked.
Markets may not be wrong and still make big moves on earnings announcements. A market is pricing expected future cash flows, and these expectations are over many states of the world and involve many different probabilities. When management announces earnings, a state of the world is realized and the market updates to the new world. The new world has different expected future cash flows and different probabilities for states of the world.
A large price swing can result for a number of reasons. First, the company may announce a state of the world the market believed only had a low-probability of materializing. Second, states of the world may be very different. If a company faces two states of the world - succeed or bankrupt - then knowing the company succeeded will boost the stock price significantly even if the market was 90% sure the state of the world would be succeed.
Still why is the market so uncertain about the states of the world? There are at least three sources of uncertainty. One source is systematic uncertainty. How well is the overall economy doing? How likely is trade to be shut down due to political turmoil? Another source of uncertainty is industry related. How will this industry fare relative to the performance of other industries? Is there a disruptive technology? Finally, there is idiosyncratic uncertainty. How well will management increase profitability by improving plant operations? How much money will management consume for private benefits instead of distribute to shareholders?
Hedge funds and investors are actively trying to discover information and price the information into the market. Still, the amount of variables in motion to learn about presents a staggering amount of information to consider.
Tuesday, February 24, 2015
Can CEOs manipulate short term stock prices?
Why might a CEO and other top executives want to manipulate the short term stock price? Two aspects of executive compensation create an incentive to manipulate prices. First, top executives have performance reviews that depend on financial performance. EPS, ROIC or ROE are example measures of financial performance. Because a large part of a manager's compensation is the bonus, managers have a strong incentive to delay expenses and move forward revenues in order to satisfy the performance review and earn the larger bonus. Tying manager compensation to stock price makes sense because shareholders are the owners and elect the Board which chooses the executives. The second aspect of compensation is that bonuses to top executives often include shares and options. On the one hand, shares and options align an executive's interests with that of the shareholders. On the other hand, a manager has an incentive to boost stock prices prior to selling shares or exercising call options to increase gains.
How can a CEO alter the performance measures? Imagine a CEO delays writing down an asset to meet analyst EPS expectations. Asset write downs hit the current periods income statement as an expense under GAAP. By delaying the asset write down, the CEO boosts the current period's GAAP EPS and shifts the write down expense to a future period, perhaps expensing the write down in a period when the opportunity for a large bonus is remote.
The phrase "in the short term" is in the title of the post because in the long term information is revealed. The CEO will disclose the write down in a future period. In the short term, the CEO would only bother to manipulate financial measures if the stock price reacts. Because there have been legal actions against executives demonstrating intent to manipulate the stock price, there is some evidence that executives believe they can manipulate markets.
Does shifting the write down expense move stock prices in the short term? Assume there is a probability that a manager is manipulating earnings in the current period and that all investors agree on the probability. Remember we do not know for sure if the manager is manipulating earnings until a future period when for example the write down occurs. Investors will bid up the stock price when seeing a higher than expected EPS figure, but investors will not bid up the price by as much as they would if they knew with certainty that the executive was not manipulating earnings.
But wait! Is not the risk that a manager is manipulating earnings diversifiable? To be diversifiable, we would be assuming a manager's choice of whether or not to manipulate earnings is independent of that of other managers i.e. not correlated with the market portfolio. If the risk is diversifiable, then diversified investors would not require a risk premium for this idiosyncratic risk (see my past post on idiosyncratic risk).
Does this mean that diversified investors will give the stock price full credit for the higher EPS even if there exists a probability the manager manipulated the EPS? No. The flaw in the reasoning of the last question is that if the stock price gave full credit to the EPS, the expected returns on the portfolio would be lower than the required return of a diversified investor. The chance that managers manipulated the EPS means there is a chance of a negative future shock to returns. If this negative shock is predictable because investors know the probability the manager manipulated the EPS, then the expected returns would be lower. Thus, the price has to react to the higher EPS but not fully even if the risk is diversifiable. The price reaches a point that conditional on all information - including information about that one firm - the expected returns only depend on covariance with the stock market.
Important: There is no risk premium for the idiosyncratic probability the manager manipulated earnings even though the price does not fully react to the EPS. The price does not fully react because there is a probability that the EPS is manipulated. The price simply reacts to the expectation of a risk neutral investor of EPS, which will be less than the reported EPS if there is a probability of manipulation.
The market's estimate of the managers probability to manipulate is uncertain. Over a long time horizon, the market learns with more precision the manager's probability. Therefore, manager's can trick the market by manipulating with a higher probability in the short term. Of course, the market will learn that the manager manipulates earnings and adjust the probability of future manipulation upwards. The manager then will have a harder time manipulating the market.
Manipulating the market requires uncertainty - i.e. the market cannot know perfectly when the manager is manipulating earnings. There also has to be information asymmetry. As we saw in the example, if the market believes the manager has a probability of manipulating earnings, then the stock price moves less than if the EPS were not manipulated. The manager can manipulate by manipulating with a different probability than the market judged. This misjudgment requires information asymmetry. For example, the market may have believed that Enron's managers had only a low probability of manipulating earnings. The highly manipulating managers had a large incentive to manipulate because the market seriously misjudged the probability of manipulation. However, the gap between true and market-perceived probability requires information asymmetry - i.e. the market is tricked. Enron's management was skilled at hiding the shenanigans from the market.
A manager does not have an incentive to manipulate stock prices by making poor investment decisions. So long as the manager communicates the investment to the market, the stock price will react more to a higher NPV project always. Stories that managers boost short term stock prices with buybacks is not plausible because the manager would have preferred to invest in any other higher NPV project and communicate the project to the market. Managers have no incentive to hide higher NPV projects from the market.
Monday, February 23, 2015
Why talk about individual stocks when the CAPM says only market risk is compensated for?
The notion that bearing firm specific risk (idiosyncratic risk) is not compensated with a risk premium is hard to grasp at first. I will try to explain why.
Asset pricing theory, i.e the CAPM, suggests that a stock's "expected" return (or risk premium) only depends on the stock's covariance with the market portfolio - the beta on the market portfolio in the CAPM. According to theory, investors do not receive compensation for bearing firm specific risk (changes in firm value that do not covary with the market) because investors that diversify do not demand compensation for this risk. Diversified investors eliminate exposure to idiosyncratic risk by a law of large numbers since an event at one firm may be offset by an event in the opposite direction at another firm. Diversified investors are willing to hold a security at a higher price than an undiversified investor because they require less compensation for the idiosyncratic risk. The diversified investor only requires a premium for exposure to the market since one cannot diversify or average out shocks to the overall market.
But, what if you are a stock picker and you focus on understanding the business and all of the idiosyncratic events on that firm's horizon? For example, what if you expect there is a chance that the firm will likely hire a new CEO or that the firm's efforts to improve profitability are likely to pay off? These events when realized or announced will lead to price increases.
Does is matter that the market does not compensate you for taking the risk that a better CEO will not be found or that profitability will not improve? After all, if the possible returns for these events are high, then I don't care about passing up on a risk premium. The flaw in this reasoning is that the market is continuously pricing idiosyncratic events. Investors are continuously pricing the market's belief of the probability that a firm will find a new CEO or improve profitability. Diversified investors are willing to price the stock so that conditional on realized changes in beliefs or information expected returns only depend on the firm's covariance with the market.
So why do mutual funds, hedge funds and stock pickers talk so much about firm specific events? Investment managers disclose in their letters to investors why they chose to invest in a particular firm or industry. Often the reasoning is something about opportunities to improve profitability, a new product launch, etc. However, asset pricing theory would say that investors already price these beliefs pointed out by investment manager's regularly in their letters. All that should remain is the risk premium for market exposure. The only way that managers can be compensated for firm specific beliefs is if their beliefs differ from the market's marginal investor (who prices the stock) and are more accurate than the marginal investor's. The more informed investor may not have an incentive to fully price the information because the investor is not a diversified investor and requires a risk premium. The more informed investor may also have limits to capital that prevent the investor from fully exploiting the information.
Clearly, the only advantage an investor can have is information that is better than the market's. The information needs to be better than everyone else's information - not just the information of the average investor. The reason is that the next best informed will already try to price in his or her information. Thus, to believe that an investment manager can earn out sized returns by picking stocks is a bet on the manager having the best information regarding a stock than every other investor.
Who may these best informed investors be? They must have deep access to the company. Large investors that sit on the boards of companies are candidates since they have great access to performance information that the market cannot have access to. CEOs and insiders are also candidates. While this better access may appear to allow for insider trading, insider trading is hard to show if the information is about long term performance not fully disclosed to the public.
I have interviewed with hedge funds and a common question is why does the market not already know this? The hurdle for a hedge fund to get better access to information is a high hurdle.
Saturday, February 21, 2015
How can social scientists be scientific?
The empiricist in economics and finance is concerned with describing behavior with data. The challenge for the social sciences more generally is that we use observational data rather than data gathered from controlled experiments. Observational data captures choice outcomes that we can observe but that we do not influence as the researcher. For example, we may observe that investors bid up a stock price one day. Did the price move up because of unexpected news specific to the company (new CEO), industry (better industry performance) or overall market (higher macro growth expectations)? In order to explain behavior in finance and economics, we need to have a sense of whether X causes Y.
Observational data contrasts with scientific data. In scientific research labs, scientists alter behavior directly by controlling a key variable - such as expression of a certain gene. The scientist hypothesize the different channels through which X affects Y and gradually eliminate channels with experiments. The social sciences researcher cannot alter someone's aversion to risk, change someone's IQ, move people around states or afford to redistribute wealth. Observational data is full of choices made by individuals. The social scientist is also trying to also figure out whether X causes Y, but the social scientist needs to use tricks in order to make such causal statements.
Let's work through a fundamental example. An important question in the economic literature for decades has been "What are the returns to schooling?" At first glance, the answer seems obvious - schooling should cause higher salaries or other outcomes. But, there are other equally plausible stories that get to the heart of whether schooling is the driver of higher salaries or something else that is correlated with schooling. For example, years of schooling may be correlated with biological IQ (if that exists). Higher IQ students may choose to get more schooling because the marginal effort of finishing homework and taking tests may be relatively lower. Higher IQ students may also get more out of the course material each year in school. In this other story, schooling is not causing higher salaries but rather revealing or signaling differences in the IQ of students.
Knowing whether schooling actually causes higher salaries is important for policy choices. On the one hand, if IQ is really important, then subsidizing schooling for the masses may break down the signaling effect. Students of lower IQ may spend more time in school, accumulate more debt and get relatively lower salaries nonetheless. On the other hand, if schooling is driving the returns, then subsidizing schooling may be the correct approach.
Social scientists look for ways to approximate the scientific experiments in life sciences research. Related to the question of returns to schooling, some authors have used the month a child is born - which is not usually a choice for mothers - to determine how age/maturity relates to schooling. Students must be 5 years of age on or before September 1 to start kindergarten that year. The youngest child in kindergarten is at a disadvantage relative to the older more mature child - and again this start year is not a choice but regulated by the government. This regulation is independent of the child's skill, family background, etc. One can use this regulation as a treatment to test whether a persistent disadvantage - being the youngest in the class - results in worse performance outcomes in later years.
One can think of skill, family background and age as three different pathways leading to choices of schooling and future salaries. Like the life sciences scientist, we want to study one pathway at a time by "knocking out" the other pathways. The regulation isolates the age pathway. By using tricks like this regulation, we social scientists can approximate the experimental design of life sciences.
If a social scientist cannot identify a specific "treatment" variable outside of the control of the actors, then another possibility is to build a model. A model describes the behavior one might expect given some initial plausible assumptions. The model formalizes the reasoning. The social scientist then brings the model to the data by testing various hypotheses the model generates. For example, if a model has 4 strong predictions, and the data matches all of the predictions, then there is evidence consistent with the model.
A stronger test would compare the hypotheses from a competing model ("another pathway") with those of the new proposed model. Any differences in the proposed hypotheses provides a test capable of differentiating models. By weeding out pathways, a social scientist can better understand the model or reasoning underlying actor's decisions.
The problem is that evidence against any model may mean two things. First, the agents may be behaving irrationally if the model is correct. Second, the model may be incorrect and fail to describe the behavior of the actors. This ambiguity with regards to evidence against the model is a joint hypothesis problem. By testing a model, one is testing both whether the model is correct and whether actors are behaving rationally. Distinguishing between the joint hypotheses is very difficult without controlled experiments.
Why is Greece still stuck after massive bailouts by the European Union? And is there a better bailout program?
Greece has made the headlines in 2012 and again in 2014/2015 for Greece's lackluster economic performance. Greece's newly elected Prime Minister Alexis Tsipras vowed to rid Greece of the shackles of austerity programs imposed by other European Union countries in 2012 as conditions for massive bailouts of 100's of billions of USD.
Since 2012, little progress has been made in Greece's economy and ability to service the debts. The chart below shows the 5 year Credit Default Swap (CDS) prices for Greece and several other European countries. A CDS price is the premium one pays to insure $100 million. Greece is the thick yellow line. Greece's CDS prices are so much higher than the other countries that the outer most y-axis is only Greece. One can see that Greece's CDS spiked above 25,000 in 2012. Interpreting the Greek CDS price, one has to pay $25 million per year to insure $100 million of Greek sovereign bonds against default for 5 years. The Greek CDS price is much lower as of February 2015, suggesting that the current events in Europe are not expected to be as disastrous.

One can see below that Greece still has a much higher 2014 Gross Government Debt as % of GDP relative to other European and developed countries. Notice that Italy, Portugal and Ireland are close behind.

Source: IMF
However, Gross Debt only examines half of the story. Greece's 2014 Net Debt as % of GDP (chart below) is also relatively higher followed again by Portugal, Italy and Ireland. Net Debt is the difference between Gross Debt and financial assets corresponding to debt instruments. These financial assets are: monetary gold and SDRs, currency and deposits, debt securities, loans, insurance, pensions and standardized guarantee schemes, and other accounts receivable.

Source: IMF
Greece's 2014 net government borrowings as % of GDP are also high along with and Italy's. The net borrowings are government net borrowings excluding interest payments on consolidated government liabilities. A federal budget that has primary balance equal to zero has federal revenues equaling spending but with a remaining budget deficit as a result of interest payments on past debt.

Source: IMF
If one compares 2014 Gross Debt as % of GDP to the 2014 primary balance, or net government borrowings (chart below), one can see that Greece, Portugal and Italy are net borrowers and have high gross debt as % of GDP. Remember the primary balance excludes the interest payments on past debt, which is significant for Greece as well. This chart suggests that Greece is not on route to improve the economy but continues to dig a deeper hole.

If one examines the 5Y CDS spreads for the past year ending February 2015, one can see a fairly considerable probability of default for Italy and Spain as well. These calculations assume a 50% recovery rate (percentage of insured notional repaid in event of default). Determining the annual probability of default (PD) using the recovery rate take the CS premium say 4% and the 50% recovery rate and calculate 4%=(1-0.5)*p, where p is the probability of default, which in this example would be p=8%.

Source: DB Research
Clearly, the Greek situation and that of Italy and Portugal are not improving despite 2 years since a major European Bailout. However, since 2012, many countries and banks have been able to reduce their exposures to Greece, perhaps limiting the possibility of contagion if Greece were to eventually exit the European Union. Greece is currently playing hardball with Germany and other European Union members but I do not see a strong hand. Germany and other EU countries are bailing Greece out with tax payer dollars, and political support for spending taxpayer dollars on Greece is likely very low.
Unfortunately, the general populace does not always understand the financial situation and are eager to vote for their own interests. Greece's citizens voted for a government that will negotiate hard - that may be good for Greece. But Greece's citizens need to understand that a world of austerity may be a better world than one were Europe runs on Greece banks and business and a exit from the European Union. If Greece fails to budge and reach a deal, then tough negotiating may lead Greece's citizens to face reductions or halts to pensions and government welfare benefits, which will hurt the poorest.
Is there an alternative to the bailout program? Well, austerity is not equal to more savings if growth slows. One can focus on saving money, but if by saving money, growth slows one can actually be poorer as a result of austerity. The bailout programs needs to favor growth in every way possible in order to believe that Greece will be able to turnaround and repay the funds.
However, the bailout program also needs to incentivize Greece to grow and to repay loans eventually. In some sense, the short term austerity measures are what provide the motivation to grow. Giving long maturity, low-interest rate debt without austerity would give Greece more flexibility, but the program does not incentivize Greece to grow since the benefits of growth eventually go to repaying other countries. Austerity is the stick that creates discontent in Greece and forces the Greek government to act today.
Thursday, February 19, 2015
How did university employment change during the financial crisis?
Universities were not spared during the financial crisis. I have been evaluating how shocks to financial resources of universities influence real activity at universities. This post focuses on the employment decisions of universities around the financial crisis.
Universities during bad times have to cut costs. One of a universities biggest costs is the staff. There are many categories of staff, such as part time workers, instructors and tenured professors. The following charts examine how employment changed.
It is not obvious how universities will treat part time staff. On the one hand, part time staff may be more easily laid off (less institutional knowledge, more temporary positions). On the other hand, universities may try to reduce large fixed costs - fully contracted employees. One way to reduce head count is to replace full time staff with part time staff. The chart below suggests there is evidence that universities were expanding part time staff in the years up to the crisis. During the crisis, universities did seem to halt growth of part time staff. Fiscal year 2010 shows a marked increase in part time staff. Fiscal year 2010 runs from July 1, 2009 to June 30, 2010. The stock market hit bottom in March 2009, so the chart is consistent with a story that universities shifted to more part time staff. Let's examine what happened to full time staff.

The chart below shows university decisions regarding full time staff. Leading up to the financial crisis, universities were adding full time staff at a fairly brisk rate. However, just a the crisis hits, there is a large drop in the growth rate to 0%. The growth remains lower than pre-crisis. This result contrasts with the sharp growth in part time positions in fiscal year 2010 of 2-3%. This evidence is again consistent with universities substituting away from full time staff in favor of part time staff.

Tenure track faculty are typically assistant and associate professors focused on securing a permanent, tenured position as a faculty member. Growth of tenured track faculty may decline for two reasons. First, universities may limit new tenure-track positions. Second, universities may transition less tenure-track faculty to tenured status. The chart below shows that on average universities were likely expanding tenure-track opportunities, especially in fiscal year ending June 2008. Once the crisis hit, positions declined markedly. The whiskers on the scatter plot are 95% confidence intervals showing that in 2008 there is evidence consistent with growth in tenure-track faculty and in 2010 and 2011 there is evidence consistent with sharp reductions in tenure track faculty.

Wednesday, February 18, 2015
Why are foreigners now holding more U.S. debt?
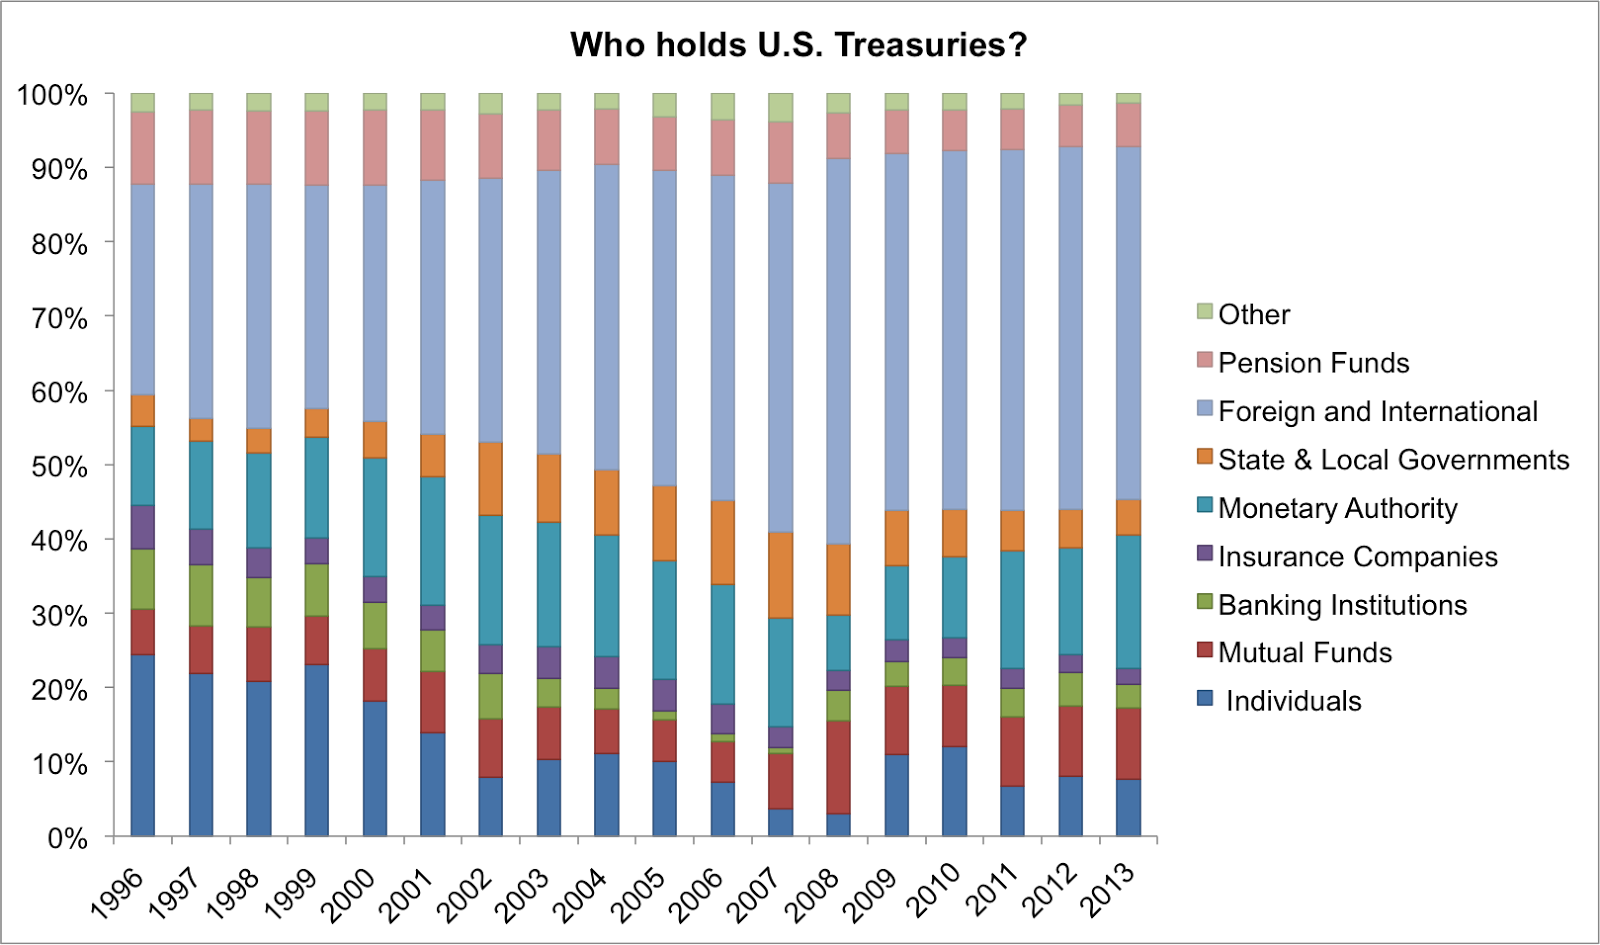
There has been a notable shift in the holders of U.S. Treasuries. As of 1996, individual households held 25% of U.S. Treasuries. As of 2014, individuals hold 7.6% of U.S. Treasuries.
There has been a large increase in the proportion of foreign and international governments that hold U.S. debt. This pattern developed during the market boom 2004-2007. In order to examine what is going on, let's look at dollar values of outstanding debt held by various parties.

The above chart suggest that the growth of U.S. government issued debt was most rapid starting in 2008. The real growth in U.S. Treasuries outstanding is clearly coming from foreign and international holders. Mutual funds and the Monetary authority also notably increased holdings.
The graph suggests that households hold a similar amount of U.S. Treasuries as in the late 1990s. Notice that households held much less in 2007 and 2008. This result is somewhat surprising. On the one hand, the financial panic should have led households to seek safe places to store money. On the other hand, the interest rate cuts may have made other investments look more attractive (not sure which ones?). Banking institutions and foreign governments continued to increase purchases of Treasuries during the boom. Treasuries were an important source of collateral for many repo market relations.
Three thoughts regarding why the ballooning of government debt accelerated in 2008:
First, the supply of government debt may have increase. A Congressional Budget Office report in December 2010 (http://www.cbo.gov/publication/21960) explains that the surge in debt stems from lower tax revenues and higher federal spending related to the recession.
However, this story about higher supply does not explain the differential growth in government debt holdings. The same CBO report notes that "many investors consider federal debt to be an attractive investment, in part because it is essentially free of any risk of default." The largest holders by far are China and Japan. By buying treasuries, China and other countries had a place to park their cash in a safe asset during the financial crisis. Buying bonds also appreciates the dollar relative to other currencies such as the yuan, which helps China's export economy.
Still, why were foreigners the principal buyers of government debt instead of other domestic institutions who also valued safety? Sean Simko, head of fixed-income at SEI Investments in Oaks ($146B AUM), commented in Nov 2014 that "U.S. sovereign debt is attractive [relative] to most other sovereign debt. In a time of uncertainty around the pace of global growth, investors look to Treasuries as an attractive investment." Other countries - EU and China, etc - have been cutting interest rates, making Treasuries relatively higher yielding. Thus, the global "bank" for sovereigns is shifting towards the U.S. in addition to the U.S. desiring to borrow to fund deficits.
Data Source: http://www.sifma.org/
Why are companies storing more cash in corporate bonds?

Clearwater Analytics keeps track of how U.S. corporations invest cash in cash-equivalent investments. One can see that from September 2010 through February 2015, companies appear to have increasingly favored parking cash in corporate debt. (click on the image to make larger)
However, one has to first check whether corporations are behaving unusually. The composition of the U.S. bond market may simply be changing over time. Companies may be passively investing in the bond market - so if more companies are issuing bonds, which they are, they may end up holding more corporate bonds. Below is a stacked chart of the U.S. bond market composition as of Q4 2013 from the Securities Industry and Financial Markets Association.

From 2010 to 2013, corporate debt increased from 18.5% to 19.8% of U.S. bond market. While this increase corresponds with growing corporate investments in corporate bonds, it is not clear that the magnitudes compare. Looking at the Clearwater Analytics chart, corporations allocated 29% to corporate bonds in December 2010 and 35% in December 2013. Corporations do seem to be choosing to overweight corporate bonds.
Why might corporate bonds be more attractive in 2013 than in 2010? Two possible explanations for this pattern:
First, companies are allocating more to corporate debt because corporate debt yields more than the near-zero interest rate on government and agency debt. However, this explanation does not explain the trend of increasing relative allocations to corporate debt over the past 5 years. Companies could have adjusted their allocations much faster.
A second part of the explanation is that whereas safety was a primary concern after the financial crisis ("Flight to Safety"), now companies are looking to earn higher yields. Issuers of corporate bonds are risky but less risky if the economy is not headed for another crisis since diversification reduces exposure to issuer credit risk.
A third possible explanation is that the Federal Reserve is increasingly likely to increase interest rates. This matters more for corporations today because they tend to be investing in longer term instruments to take advantage of higher yields. Short term interest rates are effectively zero. While the prices of short-term debt are not sensitive to interest rate changes, prices of long-term government debt have the greatest sensitivity to interest rate fluctuations because of the longer horizon. Government agency mortgage-backed securities are also very sensitive to interest rate fluctuations. Consequently, companies seem to be investing relatively less in these government and agency debts. Corporate bonds, in contrast, depend on issuer credit worthiness as well as interest rate fluctuations. Thus, companies investing in corporate bonds achieve higher yields with less sensitivity to interest rates.
We do not see the mix of investment grade and high-yield corporate bonds. I would suspect that high-yield corporate bonds are making up increasingly larger portions of the corporate bond allocation. High yield corporate bonds depend much more on issuer credit worthiness than investment grade corporate bonds and are thus much less sensitive to interest rate fluctuations.
When interest rates rise, government and agency debt becomes relatively more attractive since interest rates are relatively higher and risk is - well still very low for the U.S. gov. I would suspect that after the increase, companies will reduce allocations to corporate debt and increase investments in government debt.
Subscribe to:
Comments (Atom)